Reporting vs Analytics: Their Differences and Importance

reporting software comparison
reporting tools comparison
ucaas call center analytics
interactive reports
best reporting tools
data analysis
embedded analytics
create reports
multiple data sources
data reporting tools
by Peter Hornberger // Brightmetrics
When you think of common analytics tools, what first springs to mind? Perhaps, Google Analytics? Good guess. But, Google Analytics is not an analytics tool but actually a reporting tool. Now you may be thinking…. Is there a difference between reporting and analytics? The answer is YES!
In this article, we are going to explore the functionality of analytics and reporting, the key differences, and how clarifying your understanding of these terms can help your business work cohesively, more specifically, your business’s call center.

The Importance of Analytics and Reporting in Business
Quite simply, data is here to stay. Businesses that understand the immeasurable value that their data holds and the impact of being able to properly access it will come ahead of competitors. Better understanding data through reporting and analysis helps with decision making and action within your organization leading to increased value and enhanced performance.

What Is the Difference Between
Reporting and Analytics?
When it comes to data, “reporting” and “analytics” often mistakenly get used interchangeably in business jargon. The truth is that understanding the differences can mean a great deal to the bottom line of your company.
Preparing for a big audit project on the horizon?
Looking to hire a business intelligence officer or maybe add a few new data analysts?
Attempting to figure out how to best measure business performance?
Getting lost in the data sauce and really looking to drill down to digestible insights?
Wanting to really hone in on your key performance indicator (KPI) management?
Trying to figure out ways to incorporate machine learning into your business operations?
Then right now is the perfect time to align your strategy and be intentional with your decision-making.
Having all members of your team on the same page about what they mean when they talk about “analytics” or “reporting tools” will help your implementation plans stay on track.
Definitions of Reporting and Analytics.
Now, let’s discuss the key differences and definitions of data reporting and data analytics.
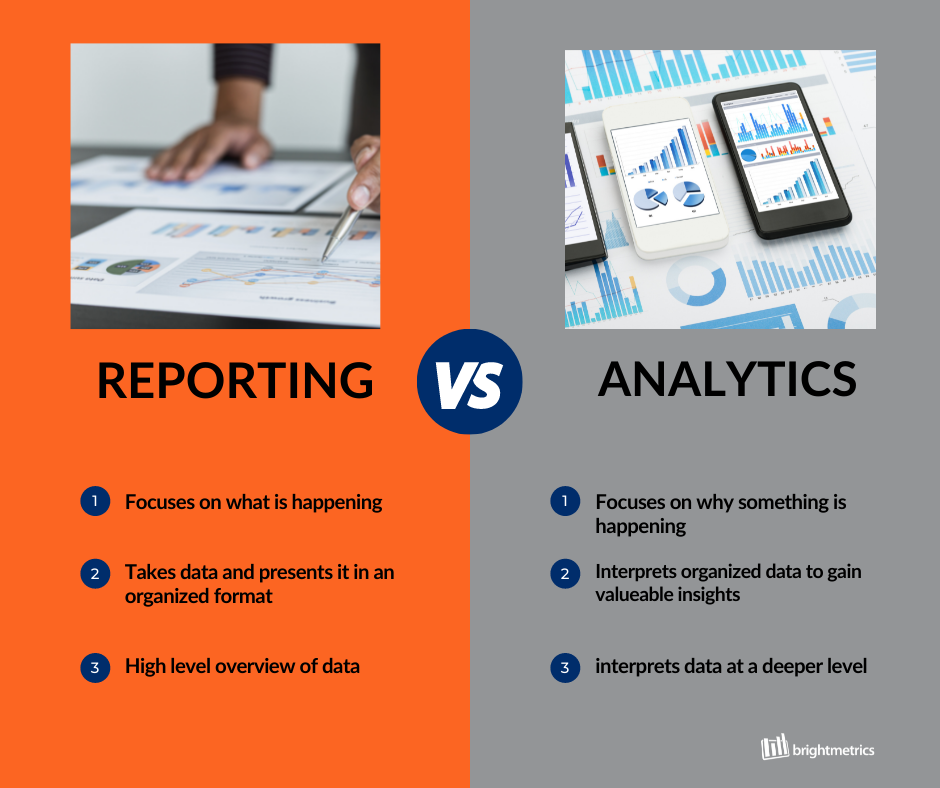
Reporting: is about taking existing information and organizing it in a way that is user-friendly and digestible. Reporting offers no judgment or insight. Data reporting often revolves around pulling data from different sources to be presented in a concise manner. Reporting should always be accurate, precise, specified, and defined as it targets answering the question of “What is happening?” in day-to-day business operations.
Analytics is about drilling down into data to look for insights that will inform business decisions by injecting business expertise into the interpretation of the data. Data analytics focuses on “why” something is happening within an organization. Analytics by nature are meant to assist in determining a course of action, predictions, or recommendations.
Reporting vs Analytics: 3 Key Differences
So what is the difference between data analytics and reporting?
1. Purpose
The purpose of reports is to take data and organize it into clear information. Analytics aims to take that data and provide insights.
2. Methods
When talking about reports or reporting you will see language being used about organizing, formatting, building, configuring, consolidating, or summarizing. Regarding analytics you will see words about investigating, performing a “deep dive”, questioning, examining, interpreting, comparing, and confirming.
Reports follow what is commonly referred to as a “push approach” which simply means, however, a report gets made it is designed to push to users. Be it a manager, employee, or consultant the deliverable on a report is that data is made available for use.
So if reports “push” then you may have guessed that by contrast analytics follow a “pull approach” where analysis is done to “pull” out the answer to whatever business question is being asked. In the case of analytics, the deliverables are predictive analytics (answers about what is going to happen in the future) or prescriptive analytics (what are ways to optimize the next steps).
3. Value
Ideally, every facet of your businesses’ process is designed to help your business grow, move forward, make more profit, or increase your value in your respective marketplace. So we want to make it quite clear that reporting and analytics are both valuable to your business model. However, reporting is about what is, and analysis is about could be. So as far as pushing your company forward you need to be able to draw insights from data to align your organization strategically. Some organizations get stuck on how to obtain and organize their data and some organizations get stuck on how to use data strategically.
Analytics and Reporting Tools for Business Call Centers and Contact Centers?
While there is a wide variety of data visualization and analytics software, few include robust reporting functionality and customization options. And due to the extensive amount of customer data call centers gather over time, management teams require both powerful analytics and detailed reporting in order to deliver excellent customer experiences.
Brightmetrics’ mission is to help teams to get more from their contact center data. Serving both the Mitel and Genesys Cloud systems, Brightmetrics’ analytics and reporting software enable teams to gain critical insights into the performance of their contact center by helping to identify key performance indicators and metrics.
Brightmetrics’ summary dashboards are easy to use, and the reporting tools can be easily customized to fit your business needs. Everyone from your call center agents to your CEO can use our intuitive drag and drop capabilities to build and schedule reports, as well as create public dashboards to keep your team up to speed no matter where they are located. Brightmetrics’ business intelligence software enables Mitel (MIVC, MICC, ECC, and MiVB) and Genesys Cloud customers to see the high-level trends and nitty-gritty details that are impacting your customers’ experiences and your agents’ performances.
Connect with our technology consultants to get started with a “Free Trial” and harness the power of your data to make intelligent business decisions and to enable your team to gain critical insights into the performance of your employees.
TeleSwitch partners with Brightmetrics, offering leading business intelligence solutions that are effective, intuitive, and simple to adopt, allowing customers to implement innovative technologies that bring the flexibility and reliability that they are looking to transform their communications data into actionable insights for their organizations
You can find the original source and some additional information by visiting the Brightmetrics website or using the direct link below.
Reporting vs Analytics: Their Differences and Importance